|
Lithospheric thickness of the Chinese Continent 中国大陆岩石圈厚度
Intruduction/简介The base of a lithosphere is also called as lithosphere-asthenosphere boundary (LAB). The depth where temperatures intersect a mantle adiabat with a potential temperature of ~1300 °C is often taken as the base of geodynamical/thermal lithosphere, and the top of the seismic LVZ (low-velocity zone) is taken as the base of the seismic lithosphere. Seismic tomography can offer 3D deep-structure model, however, the seimsic LAB defination is ambiguous. Since the thermal LAB defination is according to a definite potential temperature, it is easy to determined when a temperature model is offered. From thermoelastic parameters, temperature can be inverted from seismic velocity (Goes et al., 2000). An & Shi (2006, 2007) showed, the depth where their calculated temperatures intersect a mantle adiabat with a potential temperature of ~1300 °C (thermal LAB) is in close correspondence with the top of the seismic low velocity zone (seismic LAB) for most regions. This correspondence implies that seismic lithosphere estimated from short-time scale seismic information may be equivalent to the long-time scale geodynamical lithosphere, but also implied the temperature estimation method is reliable. Therefore, if a seismic model is obtained, a corresponding temperature also can be obtained, and LAB can be determined by thermal LAB defination. The lithosphere thickness models below are determined according to the above ideas which is explained in An & Shi (2006, 2007). CNLAB2012 -- Lithospheric thickness model /2012版中国大陆岩石圈厚度分布模型The lithosphere thickness model, CNLAB2012, will be released soon. The model is estimated from the S-velocity model of Feng & An (2010). The temperature calculation method is the same as that in An & Shi (2006, 2007). / 2012版中国大陆岩石圈厚度模型CNLAB2012将于近期发布。这个模型基于Feng & An (2010)的S波波速模型,从波速计算温度的方法的介绍见An & Shi (2006, 2007)。 Relative to Huang et al. (2003), which is used to make CNLAB2006, the seismic model of Feng & An (2010), which is used to make CNLAB2012, was resulted by more observation data, but also by a new inversion method which directly invert for a 3D model from the dispersion observations./ 从波速数据来看,Feng & An (2010)比Huang et al.(2003)用到了更多的观测数据,且利用了一种直接从观测数据反演三维模型的方法。
CNLAB2006 -- Lithospheric thickness model / 2006版中国大陆岩石圈厚度分布模型
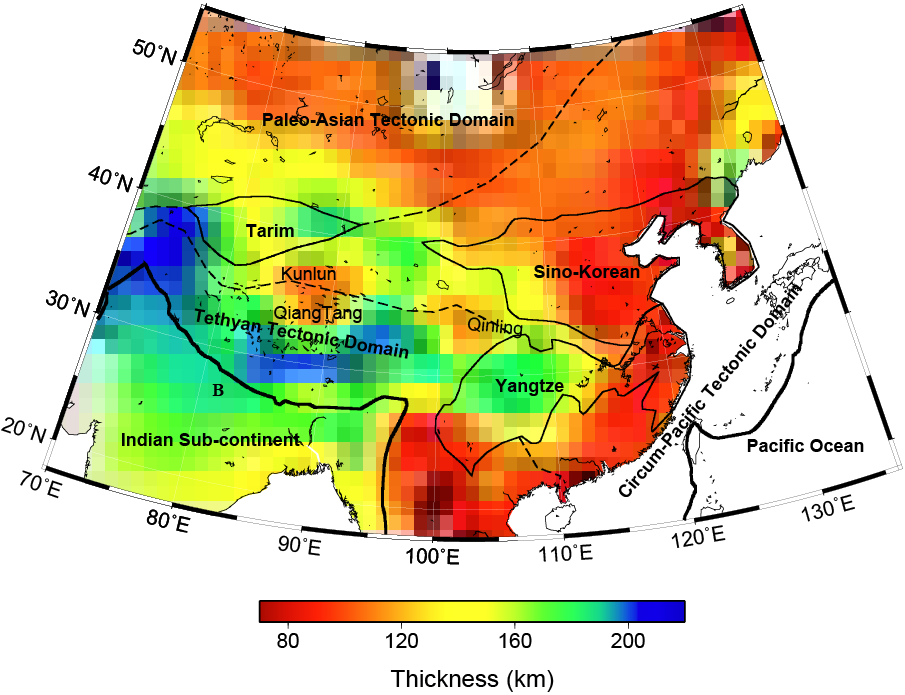
The lithosphere thickness model, CNLAB2006 (An & Shi, 2006), is estimated from upper-mantle temperatures (CNT2007) (An & Shi, 2007) of the Chinese continent in the depth range of 70-240 km and by defining the 1300 °C adiabat as coinciding with the lithospheric base. The temperatures were inverted from S-velocity model of Huang et al. (2003). [ 下载温度场/Download CNT2007 ]. [下载/download CNLAB2006]。2006版中国大陆岩石圈厚度图(An & Shi, 2006)基于An & Shi (2007)的上地幔温度模型。这个温度模型是从Huang et al. (2003)的波速模型反演而来。岩石圈厚度(岩石圈底边界深度)定义即温度值等于1300度绝热等温温度的最顶部位置深度。
References / 参考文献 An, M., Shi, Y., 2006. Lithospheric thickness of the Chinese continent. Phys. Earth Planet. In., 159, 257-266. [ go to the paper ... ]An, M., Shi, Y., 2007. 3D crustal and upper-mantle temperature of the Chinese continent. Sci. China Ser. D-Earth Sci., 50(10), 1441-1451. [ go to the paper ... ] Feng, M., An, M., 2010. Lithospheric structure of the Chinese mainland determined from joint inversion of regional and teleseismic Rayleigh-wave group velocities. J. Geophys. Res., 115, B06317. doi:10.1029/2008JB005787. [ go to the paper ... ] Goes, S., Govers, R., Vacher, P., 2000. Shallow mantle temperatures under Europe from P and S wave tomography. J. Geophys. Res., 105(B5), 11153-11169. Huang, Z., Su, W., Peng, Y., Zheng, Y., Li, H., 2003. Rayleigh wave tomography of China and adjacent regions. J. Geophys. Res., 108(B2), 2073. doi:10.1029/2001JB001696.
|