Antarctic ice sheet velocities from GPS locations logged by seismic stations
---Seismic station movement with underlying ice.
More than 97% of Antarctica is covered by ice, most inland seismic stations in Antarctica must be deployed on moving ice sheets. Seismic stations can operate for multiple years and routinely log their geographic positions and time using stand-alone, navigation-grade, single-frequency GPS receivers.
We used these location data to track the movements of the stations situated on moving ice. The results [An et al., 2015] indicate that several months of navigation-grade GPS measurements provide reliable measures of ice sheet movement of >=1 m/yr. These results with an uncertainty of ~0.3–1 m/yr resolve both very slow ice velocities near dome A, East Antarctica, and velocities of >100 m/yr, on Thwaites Glacier in West Antarctica [An et al., 2015].
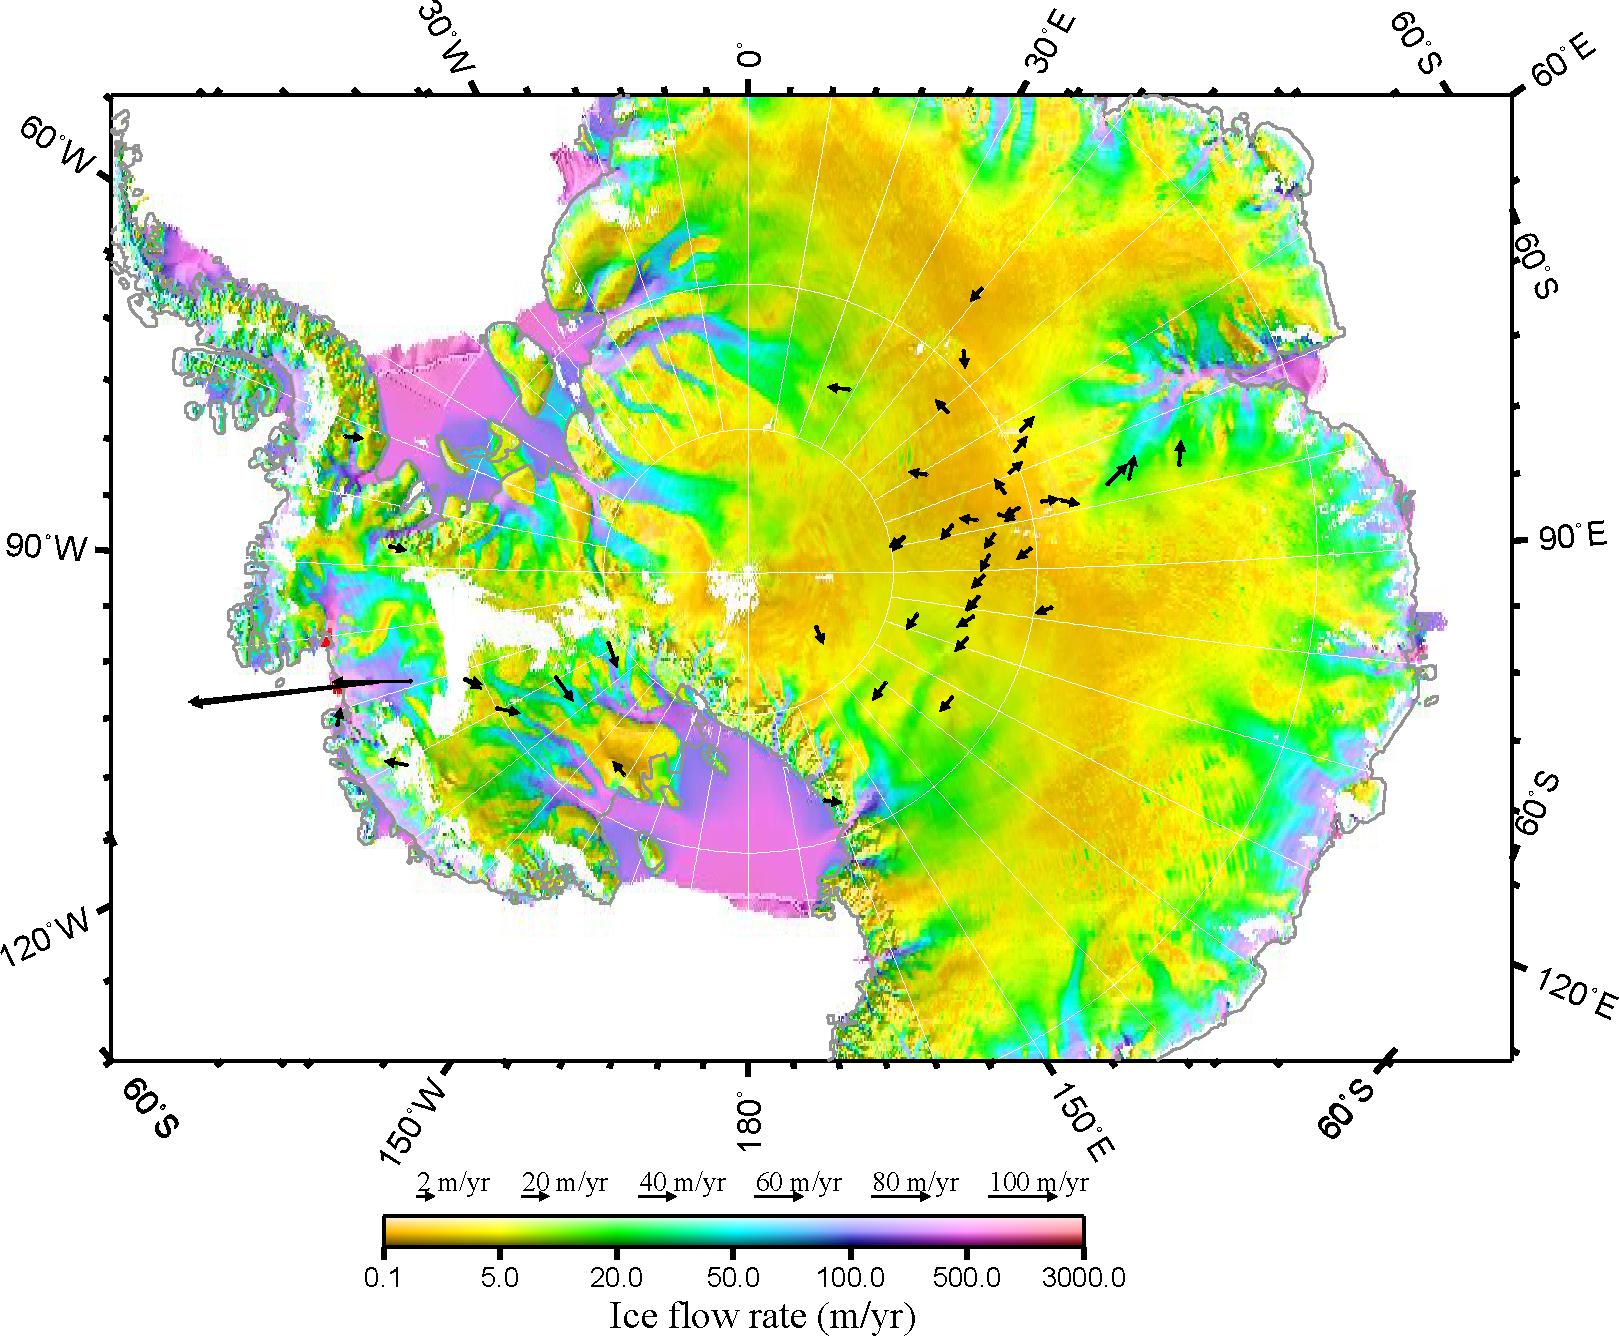
Figure 1. Ice-flow velocities over the whole of Antarctica. Colors denote the ice-flow rates from Rignot et al. [2011]. Arrows represent the average velocities of seismic stations measured from seismic-station GPS, which are from Table 1. Seismic stations are of GAMSEIS/AGAP and ANET/POLENET. Download PDF.
Table 1. Velocities of ice at seismic stations
| Station | Net | Date of Data Used | Position Mean | Mean of Velocities in intervals | Average Velocity | |||||||
| From | Until |
Longitude (°) |
Latitude (°) |
Alti. (m) |
Azimuth (°) |
Rate (m/yr) |
Uncertainty (m/yr) |
Azimuth (°) |
rate (m/yr) |
Uncertainty (m/yr) |
||
| DT154 | CHN | 17/02/2009 | 13/10/2009 | 77.02610 | -74.58247 | 2717 | -67 | 11.6 | 2.0 | -73 | 13.3 | 0.5 |
| 14/10/2009 | 22/01/2011 | 77.02558 | -74.58242 | 2719 | -67 | 12.9 | 1.7 | -71 | 13.2 | 0.2 | ||
| EAGLE | CHN | 04/01/2008 | 30/01/2010 | 77.04759 | -76.41537 | 2833 | -64 | 12.7 | 1.1 | -63 | 13.3 | 0.1 |
| EAGLE2 | CHN | 31/01/2010 | 19/01/2011 | 77.04491 | -76.41543 | 2833 | -70 | 14.0 | 2.4 | -63 | 13.6 | 0.3 |
| CHNB | CHN | 08/02/2009 | 29/01/2010 | 76.97587 | -77.17438 | 2960 | -30 | 19.4 | 1.4 | -31 | 20.3 | 0.3 |
| DOMEA | CHN | 14/01/2009 | 08/01/2011 | 77.10463 | -80.42197 | 4089 | -142 | 0.4 | 1.7 | 165 | 0.1 | 0.1 |
| AGO1 | AGAP | 15/12/2007 | 27/12/2009 | 129.61212 | -83.85959 | 2837 | 86 | 7.3 | 1.4 | 87 | 7.3 | 0.4 |
| 29/12/2009 | 14/12/2012 | 129.61428 | -83.86145 | 2833 | 92 | 7.9 | 1.3 | 87 | 7.6 | 0.3 | ||
| AGO3 | AGAP | 07/01/2010 | 02/12/2012 | 28.58188 | -82.75411 | 2932 | -112 | 9.3 | 1.3 | -111 | 9.1 | 0.3 |
| GM01 | AGAP | 15/12/2007 | 15/11/2009 | 104.72914 | -83.98585 | 3274 | 111 | 4.1 | 1.3 | 111 | 3.6 | 0.5 |
| GM02 | AGAP | 24/12/2008 | 12/09/2011 | 97.58153 | -79.42513 | 3723 | 134 | 0.5 | 1.1 | 153 | 0.9 | 0.3 |
| GM03 | AGAP | 05/01/2009 | 22/12/2009 | 85.94388 | -80.21687 | 3917 | 147 | 1.0 | 1.8 | 147 | 1.0 | 1.1 |
| GM04 | AGAP | 27/12/2007 | 17/12/2009 | 61.11243 | -82.99971 | 3768 | -151 | 1.7 | 1.6 | -141 | 1.9 | 0.5 |
| GM05 | AGAP | 29/12/2008 | 23/12/2010 | 51.15872 | -81.18411 | 3774 | -128 | 0.3 | 1.3 | -95 | 0.6 | 0.5 |
| GM06 | AGAP | 05/01/2009 | 25/12/2009 | 44.31474 | -79.33282 | 3741 | -84 | 0.7 | 1.8 | 131 | 0.2 | 1.0 |
| GM07 | AGAP | 05/01/2009 | 04/01/2010 | 39.61321 | -77.31360 | 3827 | -167 | 0.8 | 1.8 | -177 | 0.7 | 1.0 |
| N100 | AGAP | 02/01/2010 | 14/12/2012 | 122.59074 | -81.65175 | 2956 | 95 | 3.5 | 1.0 | 98 | 3.1 | 0.3 |
| N124 | AGAP | 05/02/2008 | 21/12/2009 | 107.64052 | -82.07447 | 3356 | 118 | 2.6 | 1.3 | 116 | 2.2 | 0.5 |
| N132 | AGAP | 23/12/2008 | 21/12/2009 | 101.95344 | -82.07511 | 3444 | 136 | 4.3 | 1.8 | 136 | 4.3 | 1.1 |
| N140 | AGAP | 04/02/2008 | 27/12/2009 | 96.76923 | -82.00860 | 3570 | 120 | 2.4 | 1.3 | 121 | 2.3 | 0.5 |
| 28/12/2009 | 26/12/2012 | 96.75565 | -82.01039 | 3569 | 115 | 2.5 | 1.0 | 127 | 2.4 | 0.3 | ||
| N148 | AGAP | 24/12/2008 | 21/12/2009 | 91.50757 | -81.86250 | 3697 | 138 | 0.9 | 1.8 | 133 | 1.0 | 1.0 |
| N156 | AGAP | 29/12/2007 | 21/12/2009 | 86.50448 | -81.67256 | 3845 | 95 | 1.9 | 1.4 | 121 | 1.7 | 0.5 |
| N165 | AGAP | 27/12/2008 | 23/12/2009 | 81.76038 | -81.40835 | 3969 | 130 | 0.9 | 1.8 | 133 | 0.9 | 1.1 |
| N173 | AGAP | 19/12/2007 | 19/12/2009 | 77.47358 | -81.11223 | 4063 | -6 | 0.7 | 1.6 | 31 | 0.5 | 0.4 |
| N182 | AGAP | 29/12/2008 | 19/12/2009 | 73.18979 | -80.73628 | 4050 | -105 | 0.6 | 1.8 | -108 | 0.6 | 1.1 |
| N190 | AGAP | 24/12/2008 | 23/12/2009 | 69.43101 | -80.32749 | 3925 | -19 | 0.6 | 1.8 | -19 | 0.6 | 1.1 |
| N198 | AGAP | 16/12/2007 | 27/12/2009 | 65.96070 | -79.85968 | 3781 | -26 | 2.4 | 1.2 | -27 | 2.4 | 0.5 |
| N206* | AGAP | 02/01/2009 | 21/12/2009 | 62.85557 | -79.39470 | 3663 | -17 | 3.8 | 1.8 | -18 | 3.8 | 1.1 |
| P061 | AGAP | 26/12/2007 | 18/12/2009 | 77.22381 | -84.49961 | 3515 | 140 | 1.3 | 1.3 | 142 | 1.8 | 0.5 |
| 05/01/2010 | 23/12/2011 | 77.22420 | -84.49966 | 3517 | 158 | 2.2 | 1.3 | 158 | 1.9 | 0.5 | ||
| P080 | AGAP | 18/12/2007 | 21/12/2009 | 77.36403 | -82.80542 | 3810 | 148 | 1.5 | 1.3 | 142 | 1.5 | 0.5 |
| P090 | AGAP | 05/01/2009 | 23/12/2009 | 77.31422 | -81.93605 | 4015 | -179 | 0.6 | 1.8 | -160 | 0.5 | 1.0 |
| P116 | AGAP | 26/12/2008 | 23/12/2009 | 77.04506 | -79.56690 | 3931 | 5 | 0.8 | 1.8 | 5 | 0.9 | 1.1 |
| P124 | AGAP | 27/12/2008 | 05/01/2010 | 77.65704 | -78.87184 | 3609 | 27 | 2.4 | 1.8 | 27 | 2.4 | 1.0 |
| SWEI | AGAP | 13/01/2012 | 25/12/2012 | 129.36078 | -86.98585 | 3032 | 28 | 3.3 | 1.8 | 27 | 3.3 | 1.1 |
| BEAR | POLENT | 14/01/2011 | 02/12/2012 | -111.85114 | -74.54758 | 381 | 30 | 1.1 | 1.3 | 124 | 0.2 | 0.5 |
| BENN | POLENT | 17/12/2010 | 30/12/2012 | -117.38989 | -84.57310 | 1307 | -81 | 17.2 | 1.2 | -81 | 17.2 | 0.4 |
| BYRD | POLENT | 13/01/2010 | 12/12/2012 | -119.47384 | -80.01703 | 1518 | -137 | 11.7 | 1.2 | -140 | 11.7 | 0.3 |
| DNTW | POLENT | 03/01/2010 | 27/12/2010 | -107.78011 | -76.45663 | 1038 | 8 | 327.2 | 1.8 | 8 | 327.2 | 1.1 |
| 28/12/2010 | 10/12/2012 | -107.77658 | -76.45073 | 1031 | 9 | 333.7 | 1.4 | 9 | 333.4 | 0.5 | ||
| KOLR* | POLENT | 18/01/2010 | 13/01/2013 | -120.72698 | -76.15436 | 1887 | 40 | 11.3 | 1.1 | 39 | 10.9 | 0.3 |
| SIPL | POLENT | 07/12/2008 | 30/12/2012 | -148.95533 | -81.64047 | 647 | 159 | 0.5 | 0.9 | 109 | 0.8 | 0.2 |
| UPTW | POLENT | 26/01/2011 | 07/11/2012 | -109.03833 | -77.57885 | 1333 | 16 | 115.9 | 1.4 | 16 | 117.1 | 0.5 |
| WAIS* | POLENT | 06/02/2009 | 27/12/2011 | -111.77773 | -79.41809 | 1801 | -158 | 2.1 | 1.1 | -143 | 2.0 | 0.3 |
| 28/12/2011 | 02/12/2012 | -111.77794 | -79.41805 | 1799 | -130 | 4.4 | 1.8 | -129 | 4.3 | 1.1 | ||
| WNDY | POLENT | 27/01/2010 | 15/12/2010 | -119.41369 | -82.36950 | 946 | -96 | 24.0 | 1.8 | -96 | 24.1 | 1.2 |
| CLRK | POLENT | 06/01/2010 | 24/12/2012 | -141.84851 | -77.32312 | 1041 | (on rock or stationary snow near a nunatak) | |||||
| DEVL | POLENT | 17/12/2008 | 31/01/2013 | 161.97301 | -81.47549 | 98 | (on rock or stationary snow near a nunatak) | |||||
| DUFK | POLENT | 16/01/2008 | 30/09/2011 | -53.20067 | -82.86189 | 967 | (on rock or stationary snow near a nunatak) | |||||
| FISH | POLENT | 29/12/2009 | 24/12/2012 | -143.62838 | -85.30662 | 288 | (on rock or stationary snow near a nunatak) | |||||
| HOWD | POLENT | 10/01/2008 | 23/11/2011 | -86.76933 | -77.52857 | 1497 | (on rock or stationary snow near a nunatak) | |||||
| LONW | POLENT | 31/01/2008 | 02/02/2013 | 152.73504 | -81.34659 | 1547 | (on rock or stationary snow near a nunatak) | |||||
| MECK | POLENT | 09/01/2008 | 25/11/2011 | -72.18498 | -75.28081 | 1084 | (on rock or stationary snow near a nunatak) | |||||
| MILR | POLENT | 11/02/2008 | 07/02/2013 | 156.25173 | -83.30628 | 1902 | (on rock or stationary snow near a nunatak) | |||||
| MPAT | POLENT | 19/12/2007 | 18/01/2012 | -155.02206 | -78.02974 | 540 | (on rock or stationary snow near a nunatak) | |||||
| PECA | POLENT | 18/01/2008 | 02/12/2012 | -68.55254 | -85.61237 | 1510 | (on rock or stationary snow near a nunatak) | |||||
| SILY | POLENT | 06/01/2010 | 16/12/2012 | -125.96603 | -77.13319 | 2090 | (on rock or stationary snow near a nunatak) | |||||
| SURP | POLENT | 10/02/2008 | 16/01/2012 | -171.20171 | -84.71988 | 408 | (on rock or stationary snow near a nunatak) | |||||
| THUR | POLENT | 19/01/2011 | 05/10/2012 | -97.56062 | -72.53009 | 236 | (on rock or stationary snow near a nunatak) | |||||
| WHIT | POLENT | 19/01/2010 | 07/12/2011 | -104.38675 | -82.68226 | 2341 | (on rock or stationary snow near a nunatak) | |||||
| WILS | POLENT | 11/01/2008 | 23/12/2010 | -80.55867 | -80.03962 | 694 | (on rock or stationary snow near a nunatak) | |||||
Note: * No ice-flow information at the position of the station is available in previous InSAR-based measurements in Rignot et al [2011].
References:
An Meijian, Douglas Wiens, An ChunLei, Shi GuiTao, Zhao Yue, Li YuanSheng, 2015, Antarctic ice velocities from GPS locations logged by seismic stations. Antarctic Sci., 27(2), 210-222, doi:10.1017/S0954102014000704. [Full text]. [FirstView PDF]
Rignot, E., Mouginot, J. & Scheuchl, B. 2011. Ice Flow of the Antarctic Ice Sheet. Science, 333, 1427-1430, doi:10.1126/science.1208336.